NEW YORK CITY — The number of complaints New Yorkers have registered with the city about inadequate heating in their apartments since Oct. 1. has risen 20 percent year-over-year in 2016, according to a new study by the apartment rental listings website RentHop using city data.
Excluding repeated same-day calls, the NYC Department of Housing Preservation and Development received 57,820 unique complaints via 311 about indoor heating between Oct. 1 and Dec. 18; the agency received 48,174 complaints meeting the same criteria during the same period in 2015. Landlords are legally required to heat apartments at or above certain temperatures during the city's "heat season," which extends from Oct. 1 through May 31.
Last week's arctic blast — with temperatures hovering in the mid-20s during the day — may have brought in 4,339 unique complaints, but that influx can't account for the sharp uptick in heat complaints, said the RentHop report.
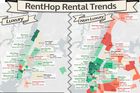
Complaints in 2016 are particularly concentrated in the west Bronx, central Brooklyn and northern Manhattan, areas that are traditionally economically disadvantage, the interactive map below shows.
While density of complaints is highest in The Bronx, Brooklyn saw the greatest number of heat-related 311 calls and the sharpest spike in calls.
According to RentHop's analysis, the three neighborhoods with the greatest concentration of complaints in New York City are: Belmont (69.6 complaints per 1,000 rental units) and Norwood (68.6) in The Bronx and Erasmus (67.5) in Brooklyn.
Neighborhoods that have seen the steepest hikes in complaints this year compared to last include:
► Oakland Gardens, Queens (172 percent, 60 complaints in 2016 vs. 22 in 2015)
► Bergen Beach/Mill Basin, Brooklyn (140 percent, 101 vs. 42)
► East Williamsburg, Brooklyn (119 percent, 236 vs. 108)
► Battery Park City, Manhattan (103 percent, 112 vs. 55)
These neighborhoods saw the greatest drop in heat complaints:
► Glendale, Queens (-41.9 percent, 50 complaints in 2016 vs. 86 in 2015)
► Breezy Point/Rockaway Park, Queens (-38.5 percent, 91 vs. 148)
► Stuyvesant Town/Peter Cooper Village, Manhattan (-37.5 percent, 50 vs. 80)
► Queensbridge/Ravenswood/Long Island City, Queens (-36.5 percent, 40 vs. 63)
Under the law, landlords must keep indoor temperatures between the hours of 6 a.m. and 10 p.m. above 68 degrees Fahrenheit when outside temperatures fall below 55 degrees. At night, building owners are required to keep apartments above 55 degrees when outside temperatures fall below 40 degrees.
In Brooklyn, a pilot program has residents using sensors from a startup called Heat Seek NYC to track and record temperatures in their homes; the data collected can be used in housing court as evidence of tenant harassment.
You can report abuses of the city's heating code here.