

We're launching a new blog called This Is New York, where we get a little more conversational. We hope you like it.
BROOKLYN — It's no secret that toxic spills are a big problem in Brooklyn, but a new map is putting the issue in clearer focus than ever. And we have to warn you, it's absolutely terrifying.
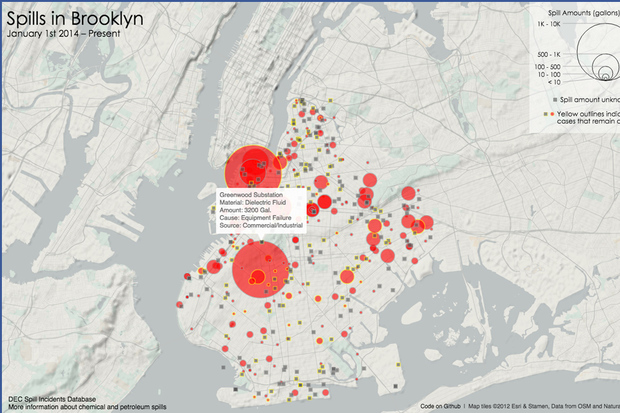
Brooklyn web developer Jill Hubley's Brooklyn Spills Map shows all of the toxic spills that have occured in the borough since January 2014. That may not seem like a long time, but the map, which was first reported on by CityLab, still managed to include a staggering 491 incidents. For the map, Hubley pulled data from the state Department of Environmental Conservation, which considers thousand substances in the department's list of possible materials, including hazardous chemicals, hazardous wastes, sewage and petroleum products as toxic.
"I was surprised by how many spills there were," Hubley, 33, told DNAinfo Tuesday. "It's worrying when you see the sheer amount."
Hubley's made the data publicly available for users to browse. A quick look at the data shows number 2 fuel oil as the most commonly spilled substance, and equipment failure as most common cause of spills. Also terrifying: 23 spills were caused by human error.
Hubley, who has lived in Brooklyn for 14 years, said she might expand the map to include spills from the rest of the city in the future. Until then we're left to look over Brooklyn and wonder questions like: "Why on earth was an unknown amount of blood spilled in Park Slope last June?"


